> ## Documentation Index
> Fetch the complete documentation index at: https://dodopayments-mintlify-external-integration-datafast-autosen.mintlify.site/llms.txt
> Use this file to discover all available pages before exploring further.
# Meters
> Transform raw usage events into billable quantities with aggregation and filtering.
Meters convert raw events into billable quantities. They filter events and apply aggregation functions (Count, Sum, Max, Last) to calculate usage per customer.
 ## API Resources
Create meters programmatically via API.
Retrieve all meters in your account.
Fetch details for a specific meter by ID.
Archive a meter to stop tracking usage.
Restore an archived meter to resume tracking.
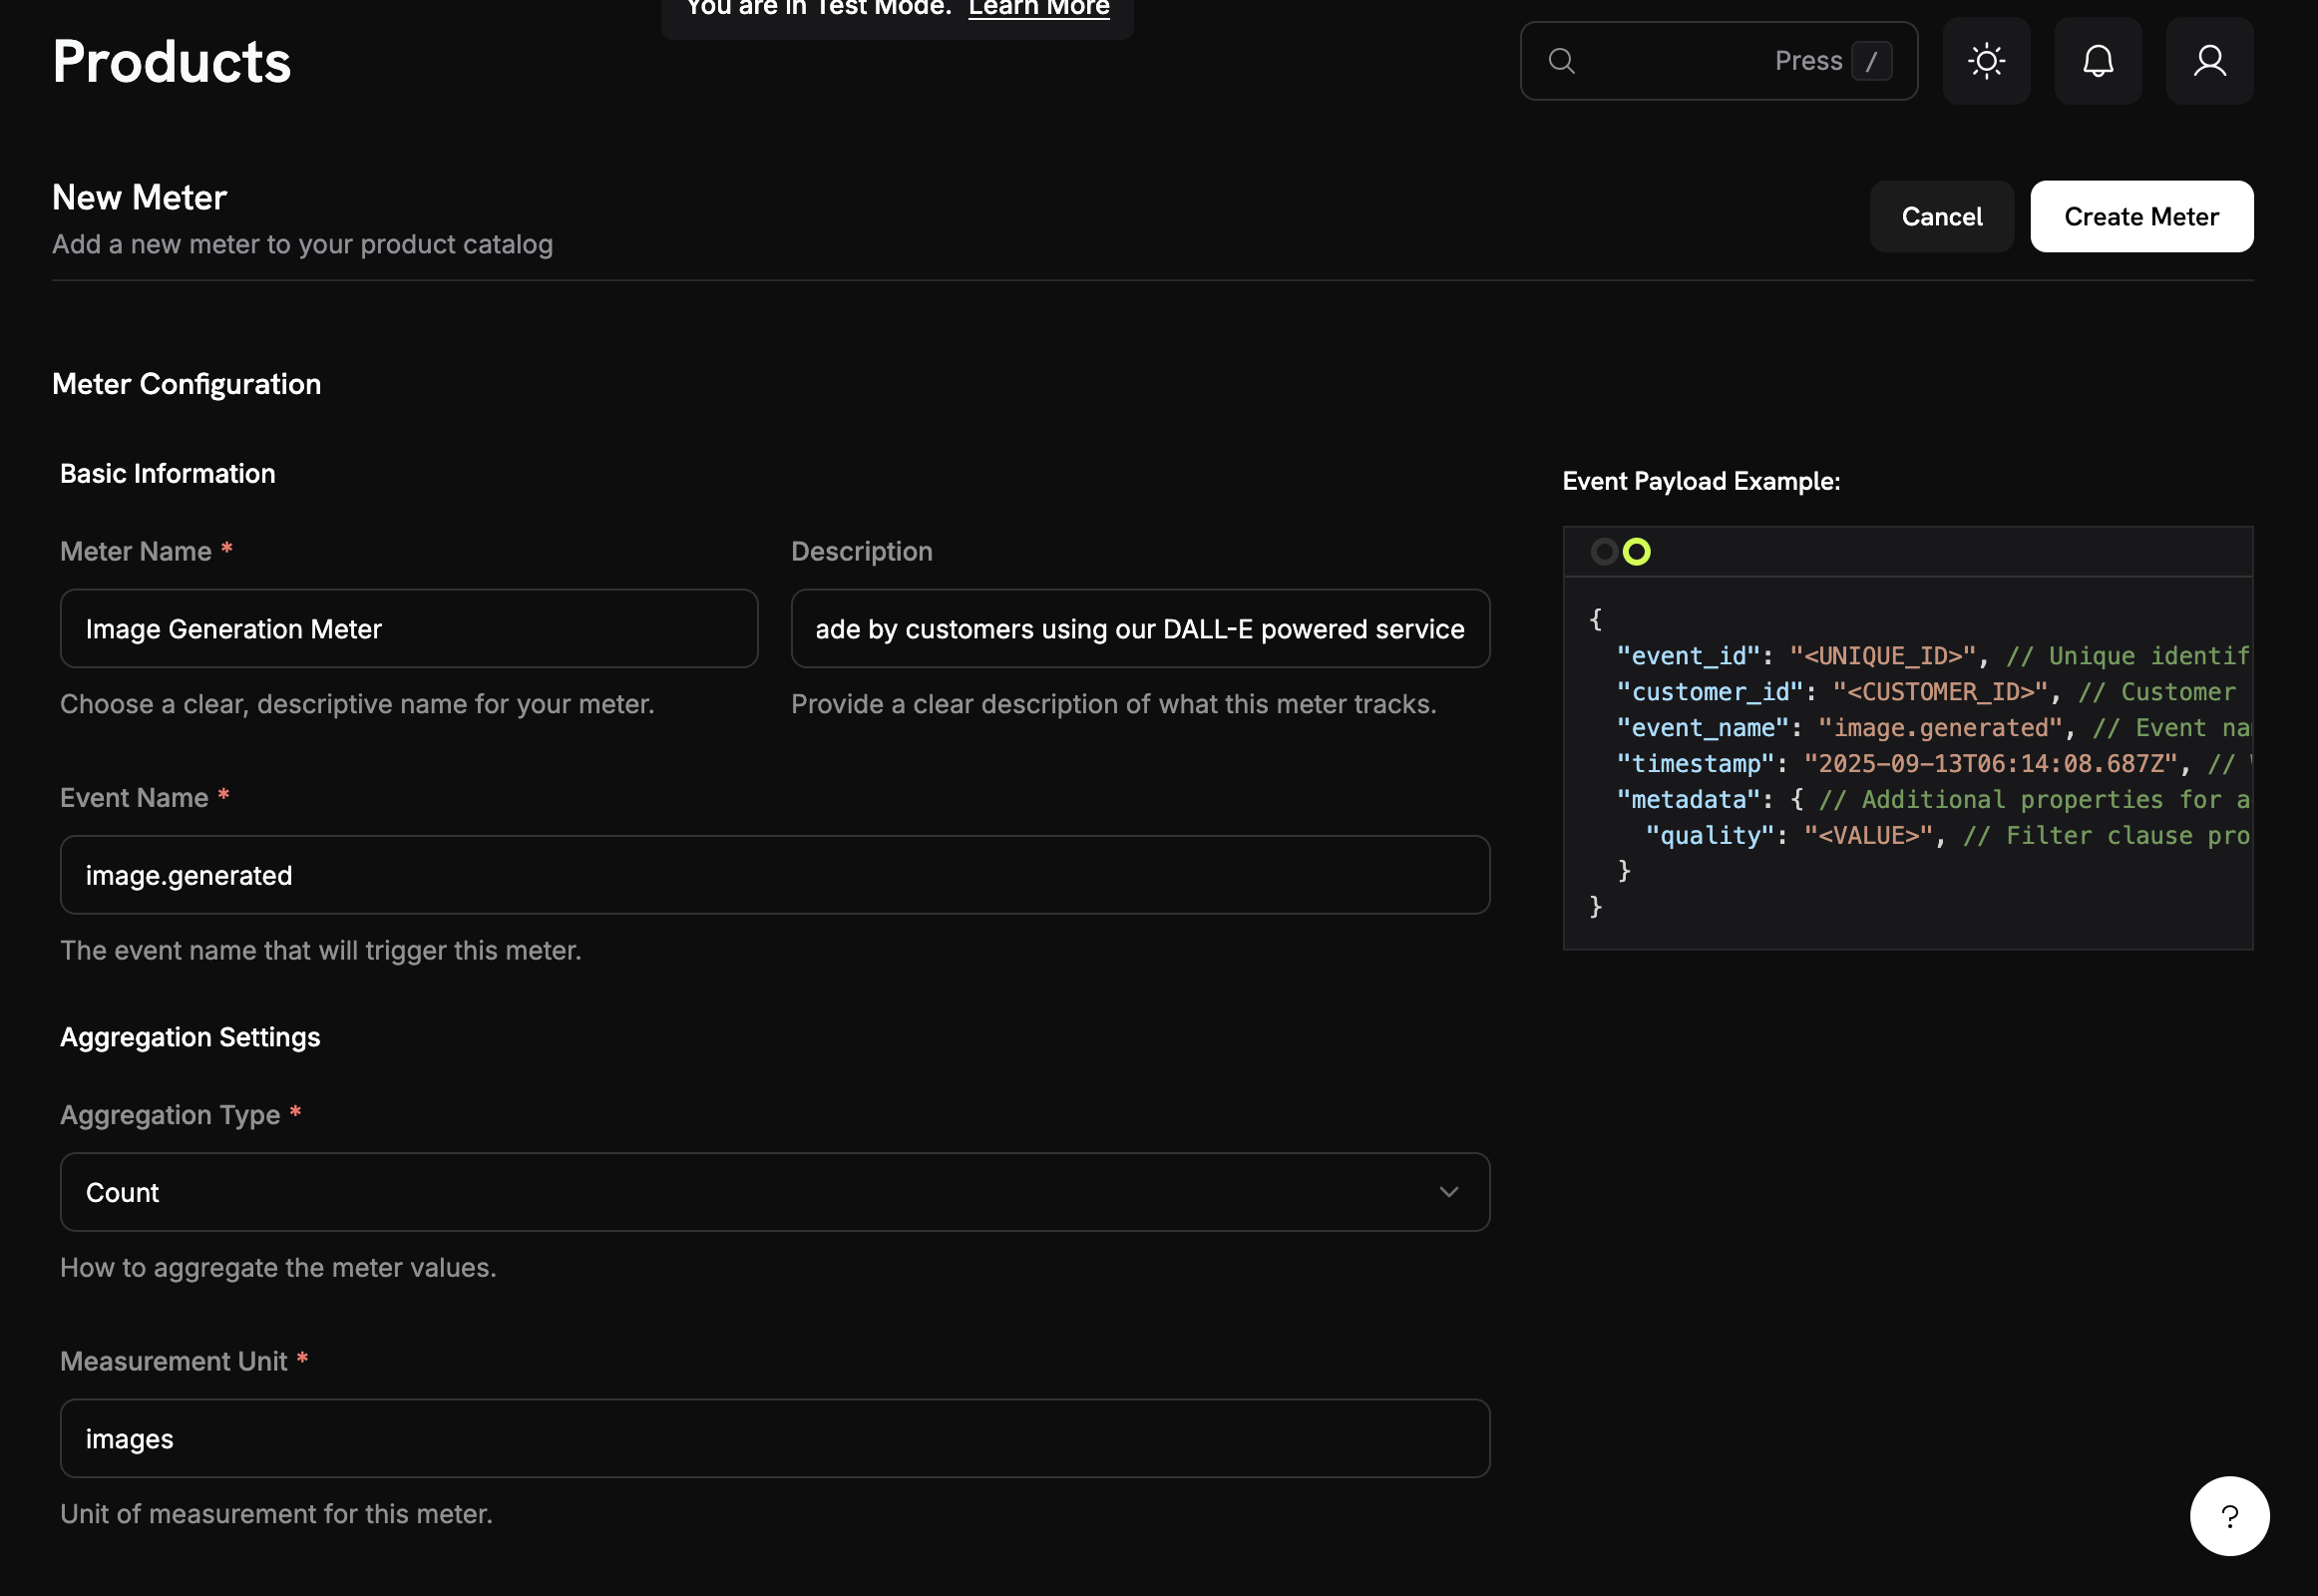
## Creating a Meter
Descriptive name (e.g., "API Requests", "Token Usage")
Exact event name to match (case-sensitive). Examples: `api.call`, `image.generated`
Choose how events are aggregated:
* **Count**: Total number of events (API calls, uploads)
* **Sum**: Add numeric values (tokens, bytes)
* **Max**: Highest value in period (peak users)
* **Last**: Most recent value
Metadata key to aggregate (required for all types except Count). Examples: `tokens`, `bytes`, `duration_ms`
Unit label for invoices. Examples: `calls`, `tokens`, `GB`, `hours`
## API Resources
Create meters programmatically via API.
Retrieve all meters in your account.
Fetch details for a specific meter by ID.
Archive a meter to stop tracking usage.
Restore an archived meter to resume tracking.
## Creating a Meter
Descriptive name (e.g., "API Requests", "Token Usage")
Exact event name to match (case-sensitive). Examples: `api.call`, `image.generated`
Choose how events are aggregated:
* **Count**: Total number of events (API calls, uploads)
* **Sum**: Add numeric values (tokens, bytes)
* **Max**: Highest value in period (peak users)
* **Last**: Most recent value
Metadata key to aggregate (required for all types except Count). Examples: `tokens`, `bytes`, `duration_ms`
Unit label for invoices. Examples: `calls`, `tokens`, `GB`, `hours`
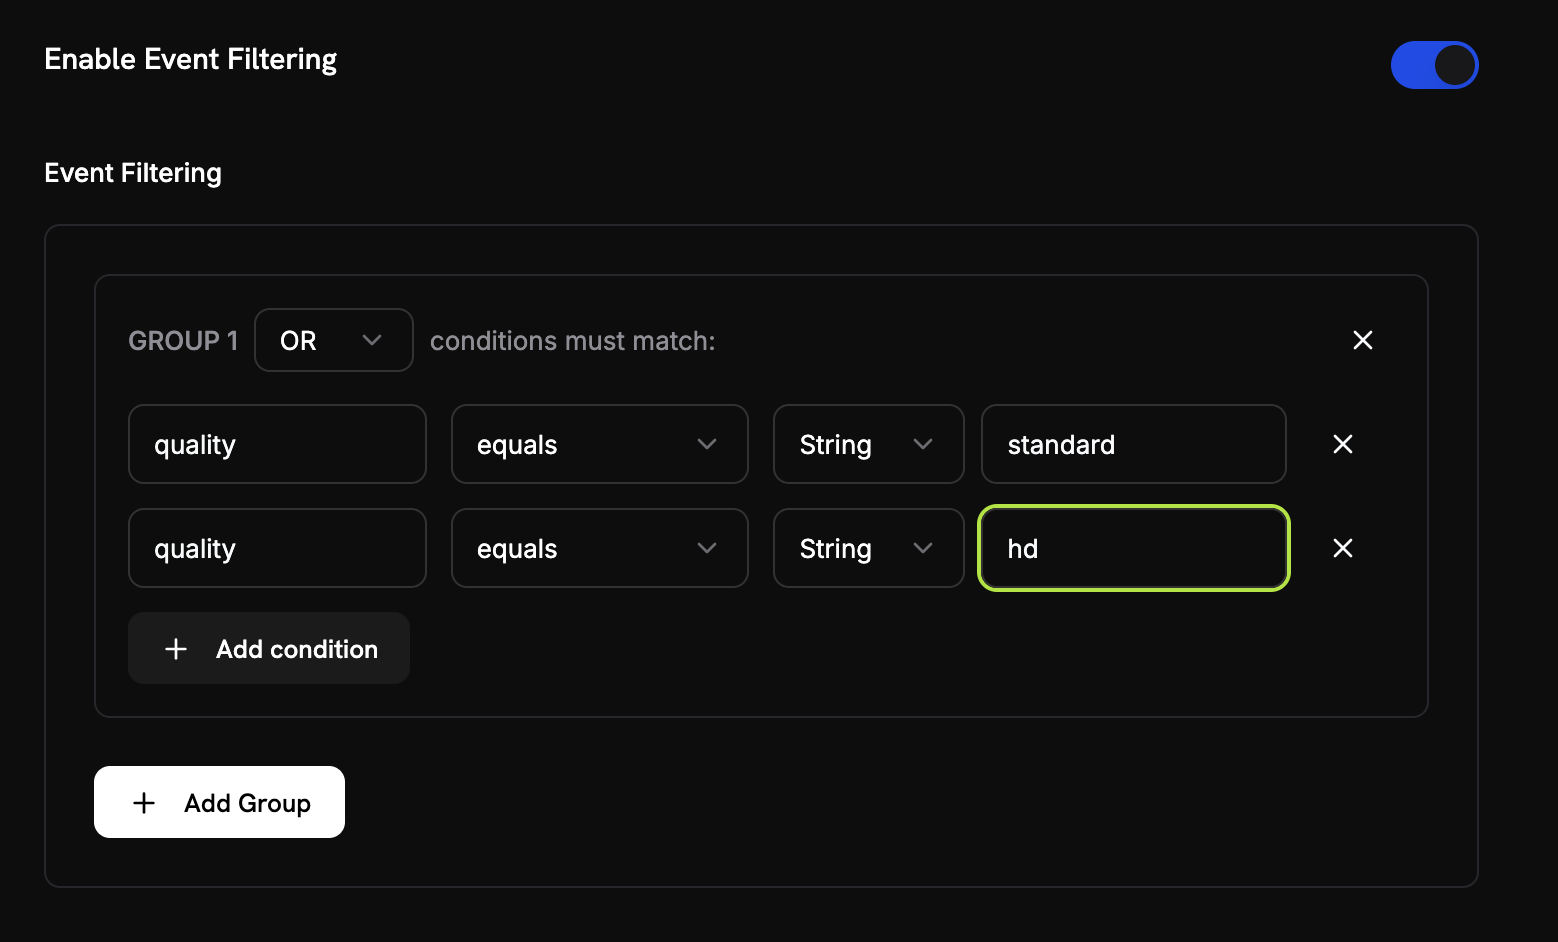 Add conditions to filter which events are counted:
* **AND logic**: All conditions must match
* **OR logic**: Any condition can match
**Comparators**: equals, not equals, greater than, less than, contains
Enable filtering, choose logic, add conditions with property key, comparator, and value.
Review configuration and click **Create Meter**.
## Viewing Analytics
Add conditions to filter which events are counted:
* **AND logic**: All conditions must match
* **OR logic**: Any condition can match
**Comparators**: equals, not equals, greater than, less than, contains
Enable filtering, choose logic, add conditions with property key, comparator, and value.
Review configuration and click **Create Meter**.
## Viewing Analytics
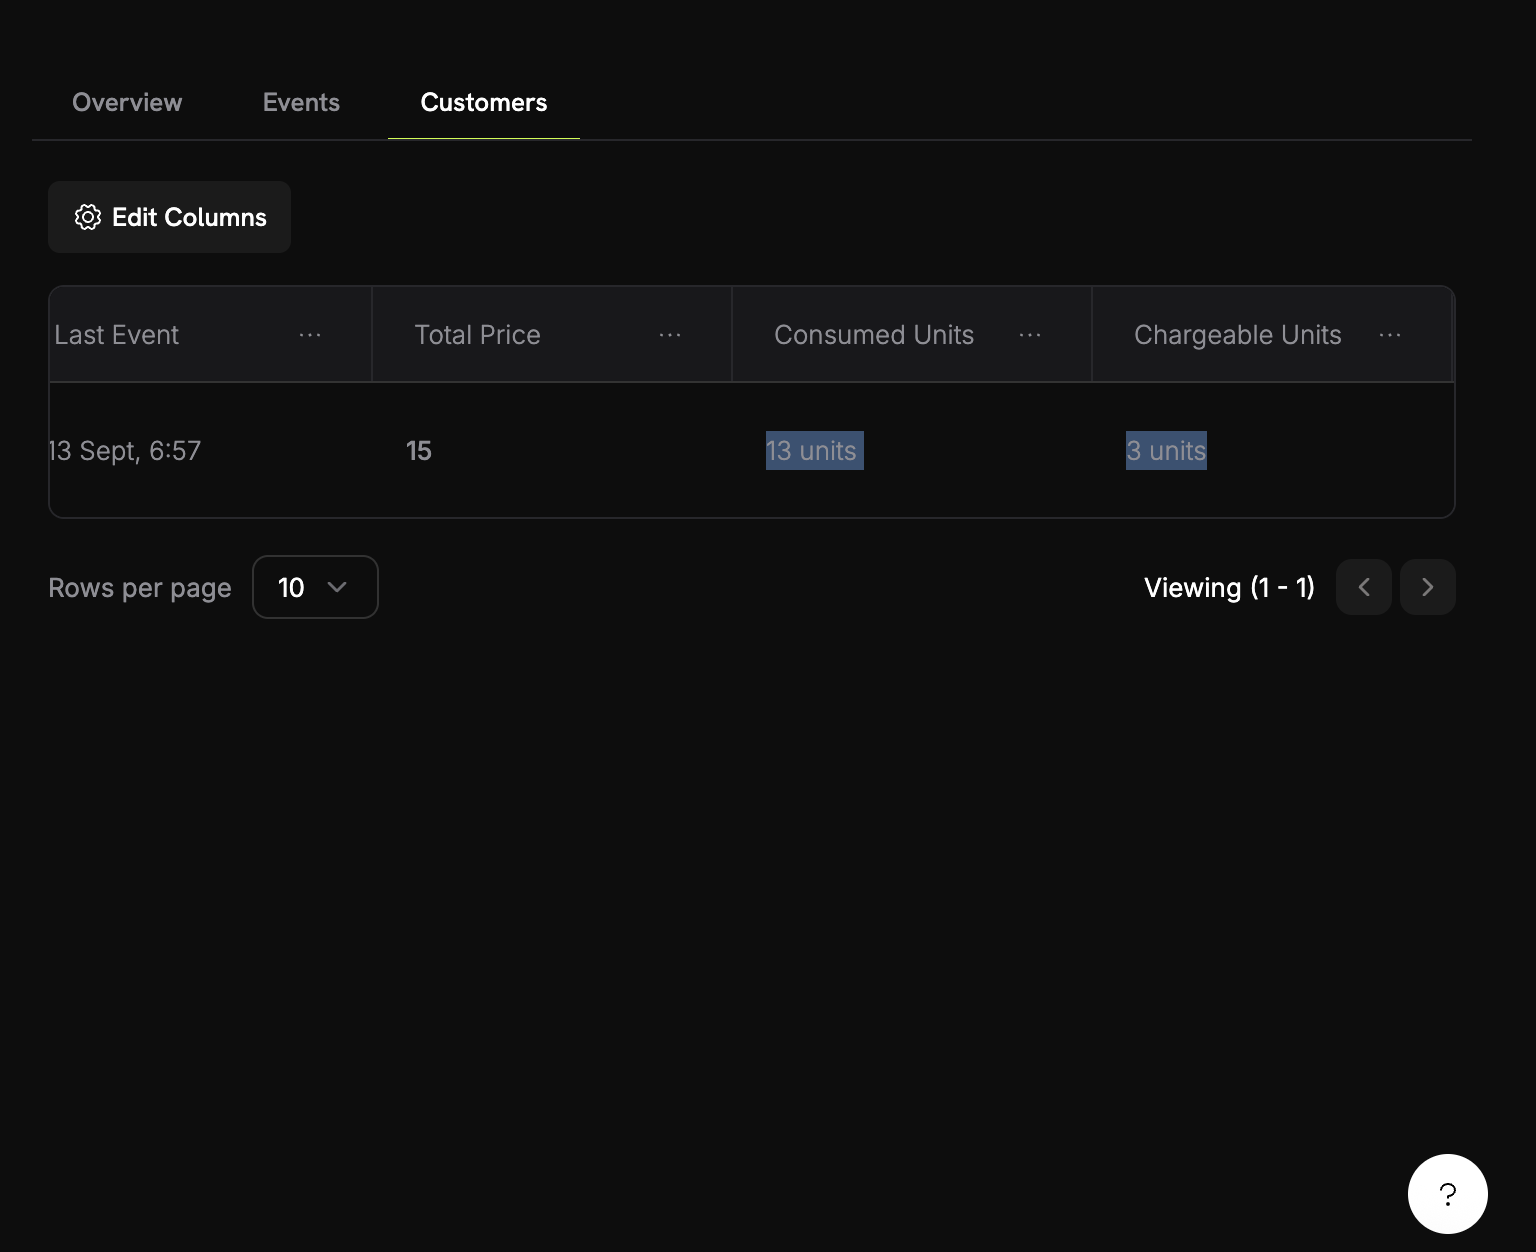 Your meter dashboard shows:
* **Overview**: Total usage and usage chart
* **Events**: Individual events received
* **Customers**: Per-customer usage and charges
## Troubleshooting
* Event name must match exactly (case-sensitive)
* Check meter filters aren't excluding events
* Verify customer IDs exist
* Temporarily disable filters to test
* Verify Over Property matches metadata key exactly
* Use numbers, not strings: `tokens: 150` not `"150"`
* Include required properties in all events
* Match case exactly
* Use correct operators for data type
* Ensure events include filtered properties
* Check Events tab to count actual events received
* Verify aggregation type (Count vs Sum)
* Ensure values are numeric for Sum/Max
## Next Steps
Start sending usage events from your application to your meters.
Use ready-made meter configurations for common use cases.
Your meter dashboard shows:
* **Overview**: Total usage and usage chart
* **Events**: Individual events received
* **Customers**: Per-customer usage and charges
## Troubleshooting
* Event name must match exactly (case-sensitive)
* Check meter filters aren't excluding events
* Verify customer IDs exist
* Temporarily disable filters to test
* Verify Over Property matches metadata key exactly
* Use numbers, not strings: `tokens: 150` not `"150"`
* Include required properties in all events
* Match case exactly
* Use correct operators for data type
* Ensure events include filtered properties
* Check Events tab to count actual events received
* Verify aggregation type (Count vs Sum)
* Ensure values are numeric for Sum/Max
## Next Steps
Start sending usage events from your application to your meters.
Use ready-made meter configurations for common use cases.